Future Scenarios module
Overview
Electricity requirements for irrigation in the future will depend on intensification and/or expansion of selected crops over the area of interest. Here follows in brief a methodology (and supporting scripts) that may be used to answer two key questions:
- What is the physical suitability of land in terms of crop “extensification”?
- How much of the potential expansion is economically feasible?
We have developed a spatially explicit approach that provides flexibility to create scenarios of future crop expansion covering both physical and economic suitability over an area of interest. Our approach builds upon a study by Chamberlin. The basic steps are presented in the Figure below.
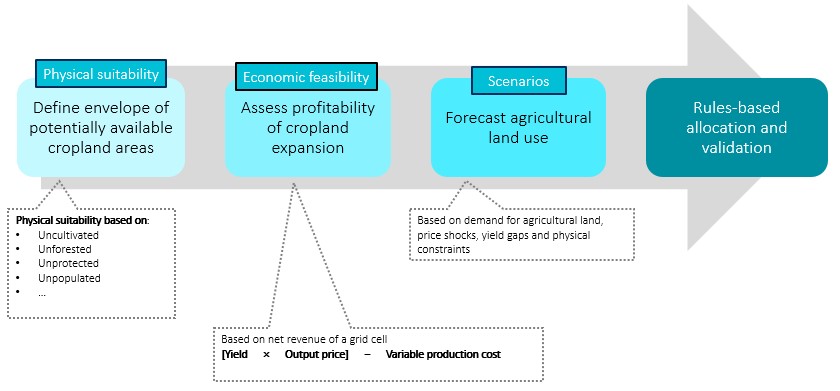
Methodological approach for generating future scenarios of crop expansion
Step 1. Involves the definition of physical suitability for expansion. That is, a layer that indicates areas where crop can be expanded in the future vs areas that are restricted from crop expansion based in bio-physical factors.
Step 2. Involves the economic feasibility of expansion. That is, a layer that indicates hot spots for crop expansion based on high expected net revenue estimates.
Step 3. Involves the combination of physical and economic feasibility layers into a proxy layer for future crop expansion that reflects indicative actions related to productivity gains, environmental resilience or both.
Input data preparation
The preparation of physical suitability (step 1) relies on the collection and processing of the following layers.
- ESA land cover map
- IUCN protected areas
- EU flood maps
- WorldPop population distribution
- Total new harvested area for the modelled crop at the end year (e.g. 2040)
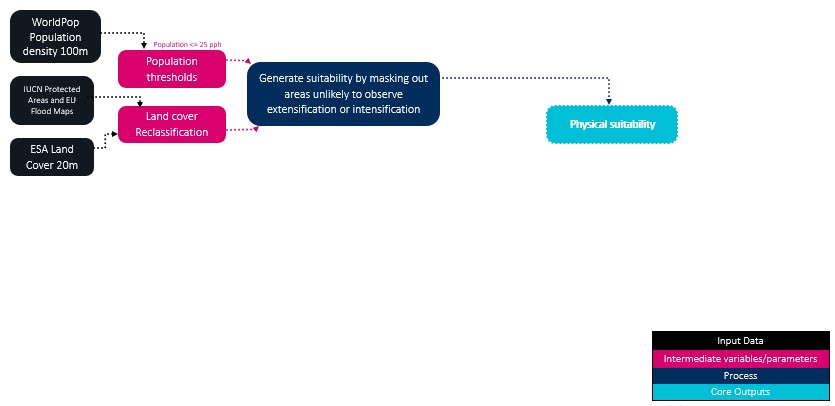
Preparing physical suitability map for future crop expansion
Data sets shall be collected and resampled at the same target spatial resolution (e.g. 500m) and projection system. Then, they shall be re-classified into binary (0-1) suitability layers. In general, for the population layer, cells with more than a threshold population (urban areas) shall be excluded from potential future expansion. For the land cover layer, built up areas, permanent snow and/or ice, open water, bare areas and no data shall be excluded. Similarly, protected areas and regularly flooded areas shall also be restricted from future expansion.
Note
The classification and/or definition of extraction zones may be differentiated based on projects mandates (e.g. environmental policy, agriculture sector plans etc.).
The preparation of economic feasibility (step 2) relies on the collection and processing of the following layers and parameters.
- Raster layer indicating the location of markets (binary 0 – 1)
- Raster layers indicating attainable yield for modelled crop (GAEZ)
- Factor of attainable yield (numerical value provided by user)
- Raster layer indicating output prices per ha of modelled crop
- Raster layer indicating production cost per ha of modelled crop
- Crop prices shock (numerical value provided by user)
- Alpha and gamma controls for distance decay equation
Following the approach of Chamberlin et al, the suggested approach used an explicit economic framework to estimate returns to agricultural production in each grid cell, based on land productivity, market access and market prices. Cells that can be profitably cultivated are considered as suitable for cropland expansion. The economic profitability is evaluated at each grid cell location in terms of gross margins. In practice, this means calculating the difference between potential revenue and production costs, on a per hectare basis.

Potential revenue at each grid cell may be derived by multiplying potential yield estimates with farm gate prices. Prices can either be assumed constant across space or made spatially explicit. The latter can be modelled using the distance decay function.
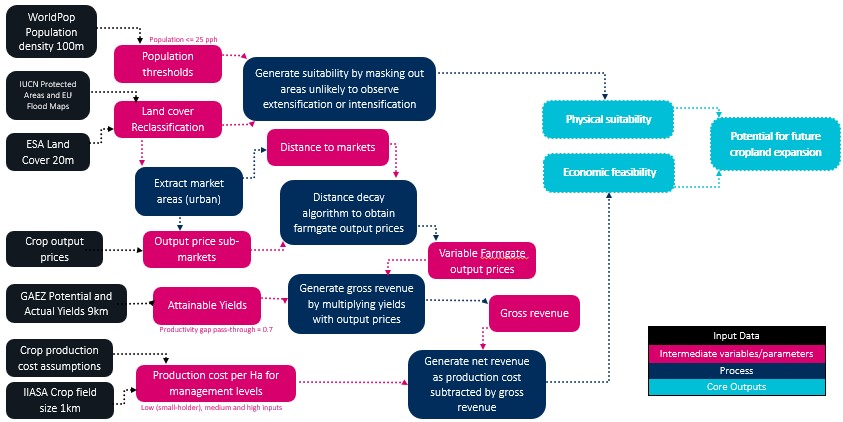
Methodological diagram for identifying potential future cropland based on physical suitability and economic feasibility
Finally, combination of physical and economic suitability layers was used to create a proxy layer for future crop expansion that reflects indicative actions related to productivity gains, environmental resilience or both. This approach allows for various future scenarios around market prices, production costs and agricultural productivity to be explored.
Model run
The methods presented above can be implemented through code available as Making Future Scenarios in the project’s repository.
Output data
The output of the model indicates potential locations of crop extensification in the future. Results are available in raster (.tiff) and can vary based on crop modelled, productivity gain assumptions and environmental resilience as described above. The Figure below shows extensification for maize in Mozambique under four example scenarios namely Sustainable Growth (SG), Environmental Stewardship (ES), Economic Growth (EG) abd Business As Usual (BAU).
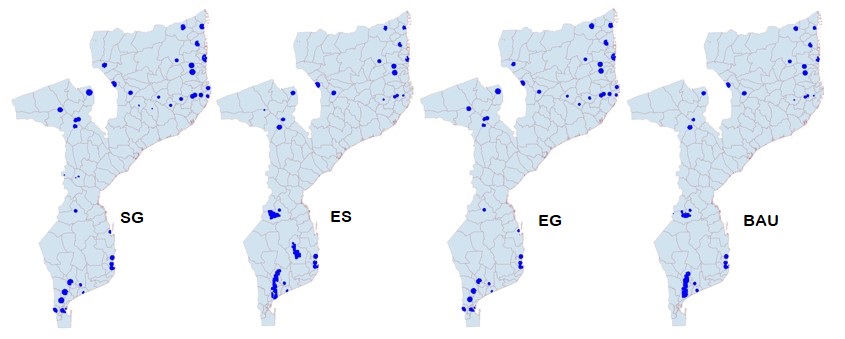
Potential areas for maize extensification in Mozambique, under the SG, ES, EG and BAU scenarios respectively (from left to the right)
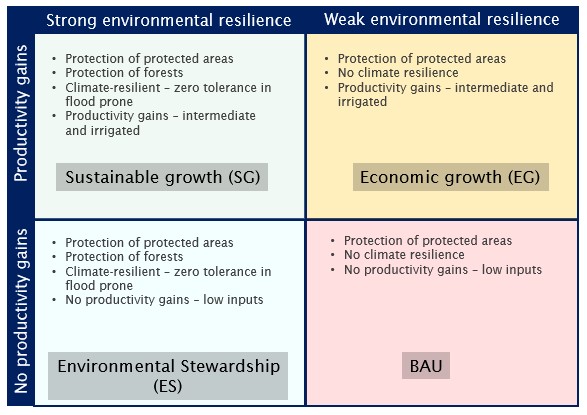
Potential areas for maize extensification in Mozambique, under the SG, ES, EG and BAU scenarios respectively (from left to the right)
Results indicating future distribution of crops can be combined with datasets indicating existing crop allocation. The latter can then be prepared and used in the agrodem model in order to estimate water and electricity requirements for the modelled crop in the future.
Special notes
This document presented a pipeline for generating future scenarios in regards to “extensification”. That is, identifying locations for new crop areas based on policy mandates.The supporting code can be used to generate several variations of the above.
Note however that the methodology presented above is bound to certain limitations. For example, we assume 100 ha (full grid coverage for 1km cells) of harvested area in new locations. Also, these may overlap between different crops as we only model one crop at a time. Future work might want to further explore those assumptions.